
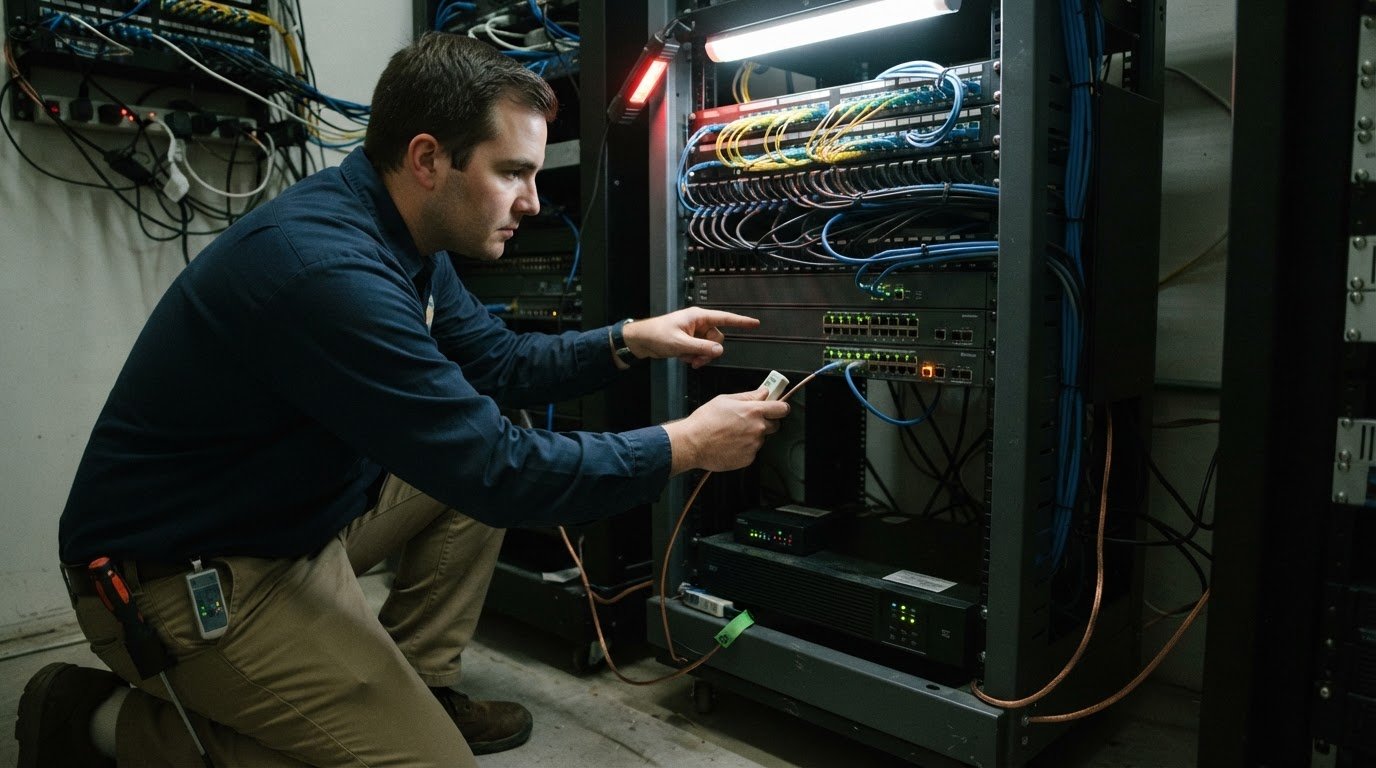
Waiting for an outage to expose a network problem is already too late. Proactive network monitoring services track device health, performance, traffic, and connectivity, helping teams spot unusual changes and respond before they disrupt work. The goal isn’t just to keep systems online. It’s to understand what is changing and why.
When applications slow down or connections become unreliable, the cause isn’t always obvious. A performance drop could point to network congestion, a device fault, or a server resource issue. Monitoring gives IT teams useful signals and historical context, so they can investigate before users are affected.
This article explains how proactive monitoring works and how it differs from reactive response. You’ll learn which metrics and trends indicate network health, and how security monitoring and compliance fit into a broader view of your environment. The result is a clearer way to spot emerging issues, prioritize response, and plan improvements using better information.
Key Takeaways
- Set alert thresholds around normal network behavior, then define who responds and what action each alert requires.
- Early detection gives IT teams a chance to address emerging issues before they disrupt users.
- Historical reports can reveal recurring peaks and changing usage patterns, helping inform capacity and upgrade decisions.
- Review CPU, memory, response time, storage, and throughput together to narrow down the cause of performance problems.
- Pair network visibility with security controls and clear documentation to support a stronger, more accountable environment.
What Is Proactive Monitoring?
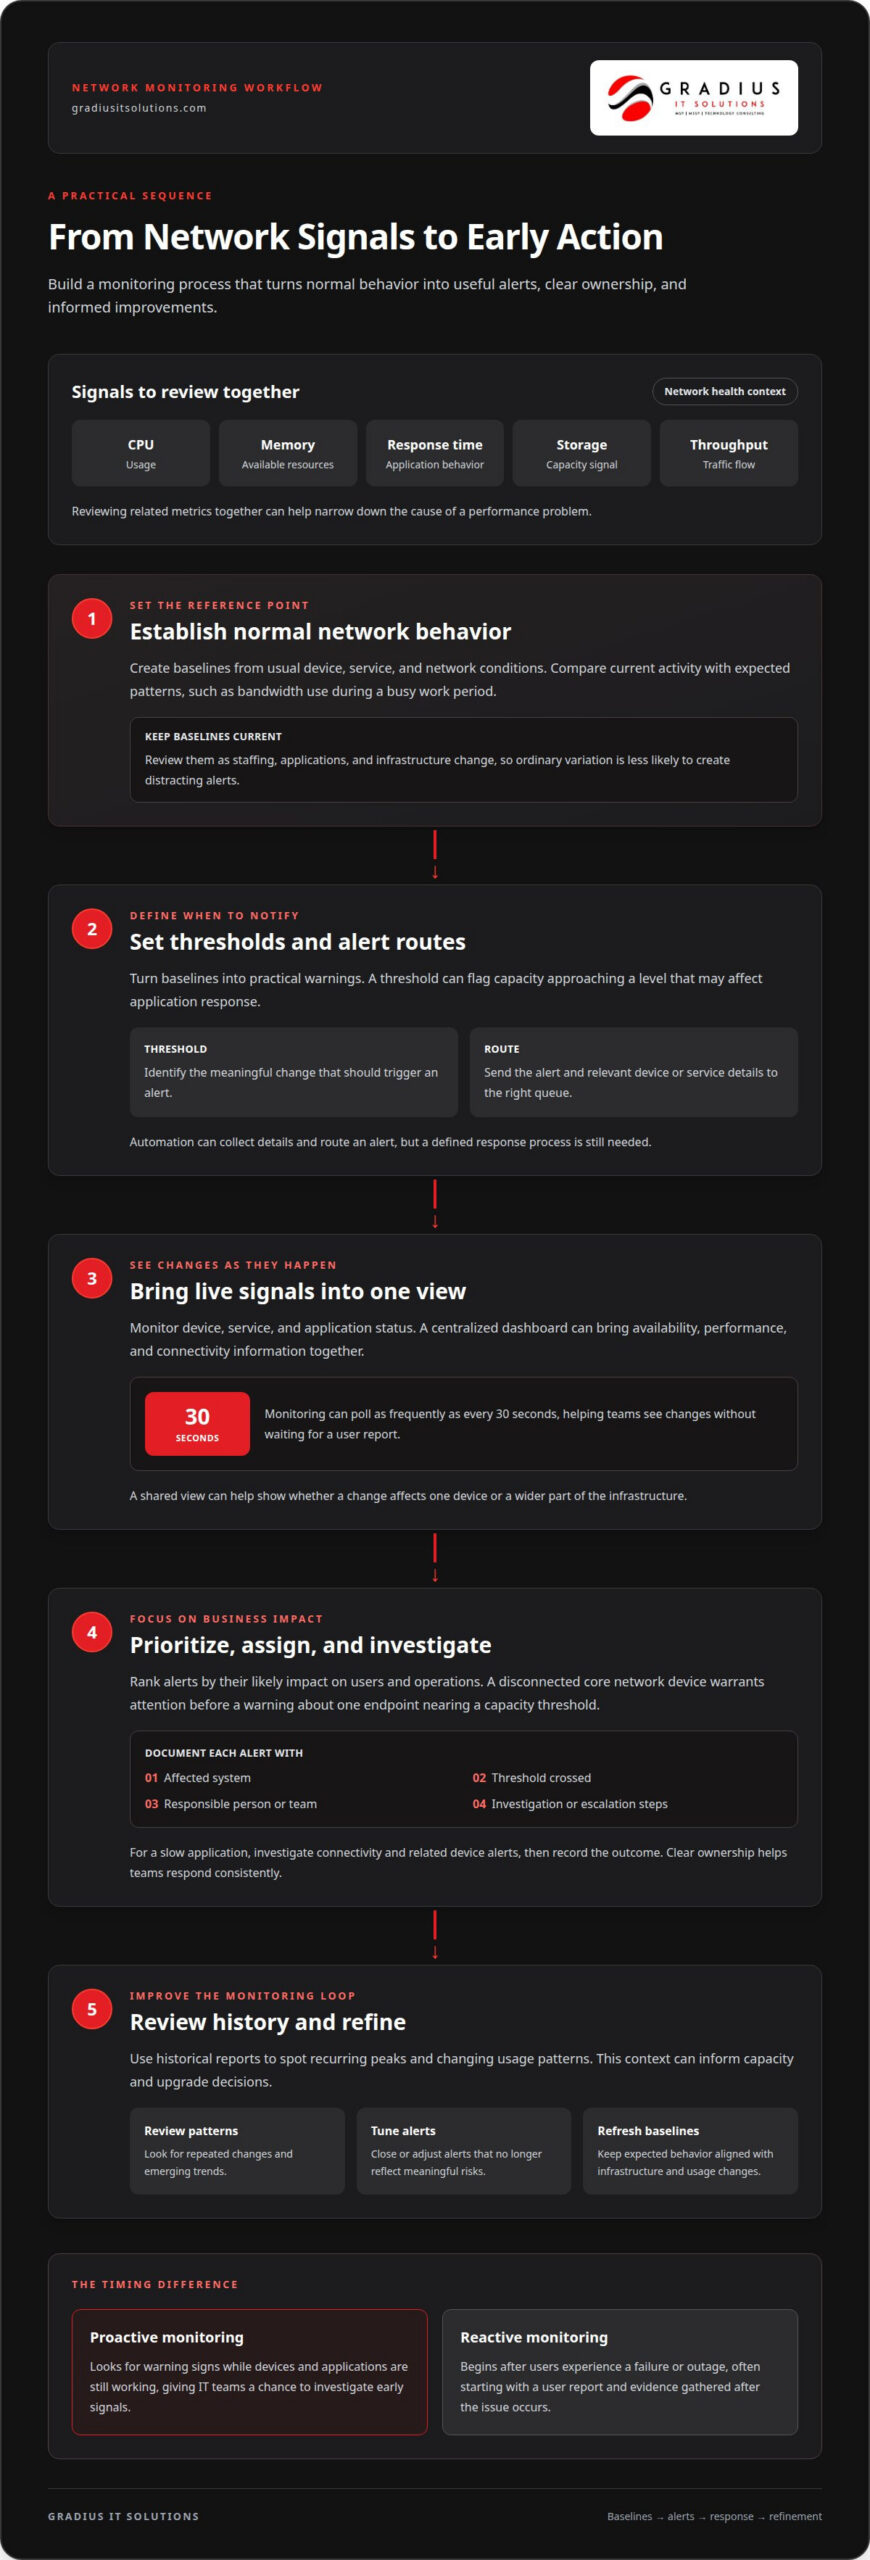
Useful monitoring features include device visibility, baselines, configurable thresholds, prioritized alerts, and documented response actions. By comparing live conditions with established baselines, monitoring can route changes for investigation before they become disruptions or outages.
Baselines, Alerts, and Automation
A baseline records normal network behavior, helping monitoring distinguish routine variation from a meaningful change. For example, a business can compare current bandwidth use with its usual pattern during a busy work period. IT professionals, developers, and business stakeholders can help establish baselines, then review them as staffing, applications, and infrastructure change. Keeping baselines current helps prevent ordinary traffic changes from triggering distracting alerts.
Thresholds turn a baseline into a practical warning system. A threshold might alert the team when capacity approaches a level that could affect application response. Automation can collect relevant device or service details and route the alert to the right queue. It supports investigation, but doesn’t replace a defined response process. A network management and monitoring plan should connect each alert to a clear next action.
Real-Time Alerts and Centralized Visibility
Real-time alerts notify IT teams when a device, service, or application crosses a threshold or goes offline. Monitoring can poll as frequently as every 30 seconds, helping teams see changes without waiting for a user to report a problem. A centralized dashboard can bring availability, performance, and connectivity information together. For example, an IT team investigating a slow connection can review device status and network conditions in one view.
That shared view helps teams detect where an issue is occurring and whether it affects one device or a wider part of the infrastructure. Alerts can flag latency, connectivity changes, or a failed device, while dashboards, maps, and reports provide context. The network management and monitoring approach can connect visibility across routers, switches, wireless access points, and other network components. This makes it easier to direct investigation instead of treating every notification as an isolated event.
Alert Prioritization and Response Actions
Alert prioritization ranks notifications by their likely impact on users and business operations. A disconnected core network device, for instance, deserves attention before a warning that a single endpoint is nearing a capacity threshold. Clear priority levels help teams focus on issues that could interrupt essential applications. They also reduce alert fatigue, which can happen when repeated low-impact notifications compete with urgent incidents.
Each alert needs a documented meaning, an owner, and a response action. A useful record identifies the affected system, the threshold crossed, the responsible person or team, and the steps for investigation or escalation. If an application slows, the response might include checking network connectivity, reviewing related device alerts, and recording the outcome. Teams should also close or tune alerts that no longer reflect meaningful risks. This cycle keeps responses consistent and helps refine thresholds as infrastructure and usage patterns change.
Proactive versus reactive monitoring
Proactive monitoring looks for warning signs while network devices and applications are still working. Reactive monitoring begins after users experience a failure or outage. A proactive alert might identify a rising error rate or a device going offline before the issue spreads. With a reactive approach, staff often first hear about trouble through a user report. The difference is timing: teams can investigate early signals before disruption, rather than starting after users feel the problem.
When a server becomes unavailable, reactive troubleshooting begins after the impact starts. Without current network data or historical logs, technicians have to gather evidence after the issue occurs. They may need to reproduce the problem, inspect device records, and determine which change triggered it. That takes staff time while users wait. Proactive monitoring can detect performance degradation or device failure earlier, giving IT teams a chance to intervene before downtime expands.
For example, imagine employees can’t reach a cloud-hosted application. Reactive investigation starts with reports from affected users and works through possible causes. A proactive monitoring strategy may already show whether the site connection, a network device, or application availability changed first. That context narrows the investigation. It can also help distinguish an isolated device issue from a broader connectivity problem, so the response focuses on the likely source rather than testing systems at random.
Managed monitoring and in-house tools can both provide network visibility. The practical difference is who reviews alerts, investigates patterns, and owns the response process. An in-house team retains direct control, while a managed arrangement can add monitoring capacity when internal staff lack time or coverage. Either approach needs defined responsibilities, relevant device coverage, and an escalation path. Tools alone don’t resolve alerts; someone must assess their impact and act.
To make monitoring useful, define which systems need coverage, who reviews alerts, and how issues are escalated. Include the devices and applications employees rely on, and clarify which team investigates and responds. For example, teams can agree on who checks a reported connectivity issue and how they share findings. Clear responsibilities help ensure alerts are reviewed and acted on, whether monitoring is handled in-house or by a managed team.
Coverage can include routers, switches, firewalls, wireless access points, physical and virtual servers, cloud environments, and business applications. The useful scope depends on how employees access essential systems. For example, a remote office relying on a centralized application needs visibility into both its connection and application responsiveness. An inventory of connected infrastructure helps identify what monitoring should cover. A managed IT services approach can suit organizations that need added capacity to monitor and respond across that environment.
Historical reporting and network trend analysis
Historical reports show how network behavior changes during busy periods, quieter days, and infrastructure updates. They help organizations distinguish a one-time spike from a recurring pattern. For example, bandwidth use at a remote office may rise during a regular seasonal busy period. Comparing reports across those periods gives IT teams useful context for capacity planning and troubleshooting.
Use historical data to guide network decisions
Trend analysis turns past performance records into practical planning information. Teams can review bandwidth usage, server resource consumption, recurring errors, and device availability. If a location repeatedly shows congestion during its busiest work period, the pattern can inform bandwidth requirements or network configuration changes. If a particular device has recurring performance issues, its history can support decisions about repair or replacement.
Reports can also help distinguish growth from temporary demand. A steady increase in server resource use may indicate expanding applications or workloads. A short-lived rise could instead reflect a temporary traffic peak. Comparing historical data with current conditions helps IT teams choose a response based on evidence, rather than treating every change as an immediate upgrade requirement. Records of past changes also help explain when a baseline needs adjustment.
Analyze logs and emerging patterns
Logs add event-level detail to broader performance reports. Network devices, servers, and applications can record errors, service changes, and connectivity events. Organizing records by time and affected system helps investigators connect events. For example, a slow application may coincide with a server warning or a network error. Reviewing those records together can narrow the investigation and show whether similar events have occurred before.
Useful log analysis depends on consistent collection and clear context. Teams need to know which device or service produced each record and when the event occurred. Grouping related entries can reveal repeated errors that a single alert might not explain. A documented timeline also helps technical staff compare an incident with earlier performance changes, identify recurring conditions, and refine monitoring thresholds as usage evolves.
Predictive analytics and machine learning
Predictive analytics uses historical patterns and current measurements to highlight conditions that may need attention. Machine learning capabilities can analyze past behavior and flag deviations for review. For example, a system might identify a gradual rise in resource consumption that resembles earlier periods of network strain. This gives IT teams an early signal to investigate, not certainty that an outage will occur.
Organizations should treat predictions as decision support, not proof of a future failure. A forecast is most useful when teams can trace it to relevant data, such as bandwidth trends, server usage, or recurring errors. IT staff can compare that signal with application changes, staffing shifts, and seasonal demand. This context helps them decide whether to adjust capacity, investigate a device, or keep observing the pattern.
Key metrics such as RAM, CPU usage, response time, storage, and throughput
A useful monitoring view connects infrastructure measurements with the applications employees rely on. CPU and RAM show server resource pressure; response time, storage, and throughput add context about delays, capacity, and data movement. No single metric explains every slowdown. Teams need to compare related signals to locate the source and choose an effective response.
Choosing and implementing a monitoring service starts with business priorities and the systems that support them. The monitoring scope should cover essential network devices, servers, cloud services, and applications. Teams can then define objectives, select relevant metrics, establish baselines, and set alert thresholds. After deployment, they should verify that monitoring collects usable data and routes alerts to a responsible responder.
CPU usage indicates how heavily a processor is working, while RAM usage shows memory demand. A database server approaching 80% memory use could trigger an alert for investigation. That signal does not prove failure is imminent. IT staff can check whether demand is sustained, whether an application changed, and whether other server resources show pressure. Pairing metrics avoids reacting to a temporary spike as if it were a confirmed incident.
Storage monitoring tracks available disk space and resource consumption over time. Throughput measures how much data moves across a connection, while latency indicates delays between systems. Packet loss and network errors can help explain why an application feels slow despite available server capacity. For example, high response times paired with network errors call for a different investigation than high CPU use with stable connectivity.
Monitoring tools collect these signals from network equipment and servers, then present them in dashboards, reports, or alerts. Some approaches use agents installed on monitored systems; agentless approaches collect information without installation. The right method depends on the environment and the visibility needed across physical, virtual, and cloud infrastructure. Application response measurements also matter when remote employees depend on centralized services.
Real-time data helps incident response begin with evidence. When a threshold alert arrives, the responder can review the affected system, compare related metrics, and identify whether the issue relates to the network, server, or application. A clear record of the alert and action taken helps with the next investigation. Teams can use the outcome to refine thresholds, improve escalation paths, and prevent repeat interruptions.
Metrics are most useful when tied to user impact. A server warning may need attention, but slow access to a critical application can demand faster investigation. Monitoring objectives should reflect which services support essential work, how quickly staff need to diagnose disruptions, and which signals best reveal those conditions. This keeps responses focused on business impact, not dashboard volume.
Network security monitoring and compliance
Network security monitoring adds a security perspective to operational visibility. It tracks network activity and device conditions, helping teams notice unusual changes that performance metrics alone may not explain. For example, an unexpected traffic pattern or repeated connection errors can prompt an investigation. Monitoring supplies evidence for response, but it doesn’t replace preventive controls or a complete security program.
Useful monitoring draws on multiple sources. Network devices can provide information through SNMP, the Simple Network Management Protocol, while servers and applications contribute their own logs and status data. Reviewing these signals together can help distinguish routine performance fluctuations from activity that needs security review. For instance, a sudden traffic change alongside device errors gives responders a reason to examine both the network path and related system records.
Continuous monitoring works best as part of layered security. A team can pair network visibility with multi-factor authentication, endpoint protection, email security, and backup and disaster recovery planning. Each control addresses a different risk. If an employee reports a suspicious email, for example, security staff can investigate while monitoring relevant account and network activity. Employee awareness and clear reporting paths help surface concerns automated systems may not identify on their own.
Monitoring also supports compliance work by creating records of system activity, alerts, and response actions. Those records can help organizations understand what happened, which systems were involved, and how a concern was handled. They don’t establish compliance by themselves. The applicable framework, internal policies, and required evidence determine which documentation matters. Keeping alert records connected to response notes makes security activity easier to review and explain.
Make the process operational: verify monitoring after deployment, confirm that expected devices and services are visible, and test whether alerts reach their assigned responders. Document what each security alert means, who investigates it, and how the outcome is recorded. Review alert patterns and access changes regularly. If teams receive too many low-value notifications, tune thresholds so urgent issues don’t get buried. Clear ownership turns collected data into a timely, repeatable response.
The key takeaway is simple: monitoring strengthens security when it connects useful signals to layered controls, accountable response, and documentation aligned with the organization’s framework. It can improve visibility and support compliance evidence, but people still need to assess alerts and act on them.
Gradius IT Solutions: Compliance as a Service
Gradius IT Solutions helps connect network oversight with the documentation and governance processes organizations need to maintain. Its Compliance as a Service includes a GRC platform that keeps technology aligned with your framework and documentation audit-ready. This can help when your network, cloud environment, or security controls change and you need technology records to stay organized with those changes.
For organizations that need broader operational support, Managed IT Services and Cybersecurity & SOC can complement compliance-focused work. The right fit depends on whether your priority is maintaining framework-aligned technology, strengthening security monitoring, or coordinating both.
Make network visibility part of the next decision
Monitoring is most valuable when its findings shape what happens next. Use network insights to set technology planning priorities, coordinate security response, and keep operational records aligned with your organization’s needs. If your team lacks the time or expertise to connect these responsibilities, proactive network monitoring services can form part of a broader support strategy.
Gradius IT Solutions provides Managed IT Services, Cybersecurity & SOC, and Compliance as a Service. These services can help organizations coordinate network operations, security monitoring, and framework-aligned technology documentation. The right starting point depends on the gaps your team needs to address, whether that means improving visibility, assigning response ownership, or keeping governance records organized.
Take the next step by discussing your network priorities and the support that fits your environment.
A clearer view of your network can support more confident decisions and stronger day-to-day operations.
Frequently Asked Questions
What Is Network and Server Monitoring?
Network and server monitoring tracks whether connected equipment and computing systems are available and performing as expected. Network monitoring focuses on connections and devices such as switches, while server monitoring tracks resources and running services. Together, these views can help trace a business application issue across systems. For example, if an internal tool becomes unreachable, teams can investigate the server and network path instead of treating them as unrelated problems.
Why is reactive troubleshooting less effective?
Reactive troubleshooting starts after a user or system reports a disruption, so the original conditions may have changed by the time an investigation begins. Staff may need to gather logs, reproduce the fault, and identify which system was involved. For example, an intermittent connection problem might disappear before a technician examines it. Monitoring records can provide context from before the report, helping the team narrow its investigation instead of relying only on user recollections.
What are proactive network monitoring services?
Proactive network monitoring services combine ongoing observation of network conditions with alerts and a response process. Their value depends on whether monitoring covers the systems that matter to the business and whether someone owns each notification. For example, a company that depends on a hosted scheduling application should include the network connection and application availability in its monitoring scope. Clear ownership ensures alerts lead to investigation rather than simply accumulating.
What service-level agreements and response times should customers expect?
Expect a written agreement to distinguish response time from resolution time and define how urgent incidents are escalated. Gradius IT Solutions lists an average first response under 15 minutes. That figure describes the initial response, not a guaranteed repair time. Its 24/7 coverage applies to NOC and SOC monitoring. Review how the agreement defines alert severity, who receives escalations, and which systems fall within monitoring scope.
What security and compliance risks should businesses consider when choosing a provider?
Consider whether monitoring access is limited to appropriate personnel, alerts have named owners, and incident records are retained with clear context. Establish which systems and data the monitoring process can access. For compliance, technology records should align with the organization’s framework, while the organization remains responsible for its own obligations. A practical review can map each monitored system to its business purpose, access permissions, alert route, and documentation owner.

Article by
Robert Joyce
Robert Joyce is the Owner and Chief Technology Officer of Gradius IT Solutions, a security-first provider of managed IT, cybersecurity, cloud, compliance, and secure AI solutions. Headquartered in New Jersey with satellite offices in the Midwest and South Florida, Gradius serves businesses across the Tri-State Area, Midwest, South Florida, and nationwide.
Robert brings 30 years of IT experience, including 23 years in hedge funds, global banks, and wealth management firms where uptime, security, and continuity are non-negotiable. He began in trade floor support at Caxton, Shell Trading, and Knight, provided senior trade floor support at RBC and SAC Capital, served as VP of IT at EntrustPermal, and was CTO of Gerstein Fisher. After September 11, he helped rebuild critical technology infrastructure for Merrill Lynch.
His expertise spans Microsoft 365, cloud, cybersecurity, networking, infrastructure, disaster recovery, compliance, and strategic IT leadership.
Robert founded Gradius to bring enterprise-level technology and security to small and midsized businesses at a predictable monthly cost. Gradius delivers managed and co-managed IT, cybersecurity, Microsoft 365 and cloud, compliance programs supported by a GRC platform, secure AI consulting, and vCIO services, with a full help desk, 24/7 NOC and SOC monitoring, and U.S.-based onsite engineers and SOC.
Robert works directly with business owners and executives as their single accountable point of contact. His philosophy: one trusted partner, complete IT accountability.
Disclaimer
## Disclaimer
The information provided in this article is for general informational and educational purposes only and should not be considered professional IT, cybersecurity, legal, regulatory, or compliance advice. While Gradius IT Solutions strives to provide accurate and up to date information, technology, security threats, and regulatory requirements change frequently, and we cannot guarantee that all information will remain current or applicable to your specific situation.
Every organization has unique technology, security, compliance, and business requirements. Before implementing any recommendations discussed in this article, you should evaluate their suitability for your environment or consult with a qualified technology professional.
Gradius IT Solutions makes no warranties, express or implied, regarding the completeness, accuracy, reliability, or results obtained from the use of this information. Any actions you take based on this content are at your own risk. Gradius IT Solutions shall not be liable for any direct, indirect, incidental, or consequential damages arising from the use of, or reliance upon, the information contained in this article.
References to third party products, services, or vendors are provided for informational purposes only and do not constitute an endorsement unless explicitly stated.
If you would like guidance tailored to your organization, contact Gradius IT Solutions to schedule a consultation with one of our technology experts.